key:value you can click or type.
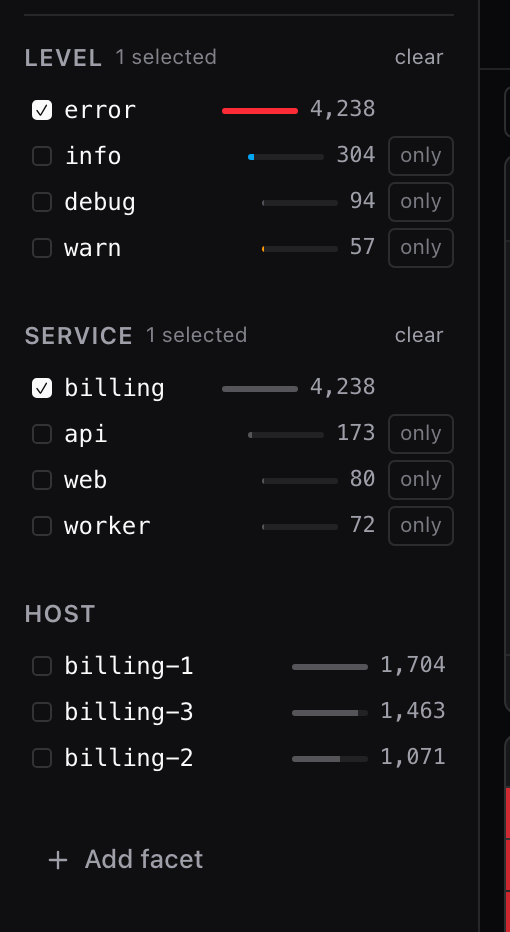
Counted facets before you click. The same string goes in the bar and the postmortem.

What you wantWhat you type
Only errorsone click in the sidebarlevel:error
Errors in billingadd a servicelevel:error service:billing
Errors or worse, on the APIgroup values(level:error OR level:fatal) service:api
Everything except the noiseexclude a service-service:heartbeat
The slow ones, past a secondnumbers compare as numbersduration_ms:>1000
The same application errorfingerprint written at ingeste1:3f8c1a2b9d0e4f71
One customer, one orderone case, end to endcustomer:acme order_id:ord_5821
One customerClick their id. Five minutes either side, every service they touched, in a new tab.
SurroundingsRead around one line. The search you arrived with stays marked, not applied.
A second tryDuplicate the tab and change one thing.
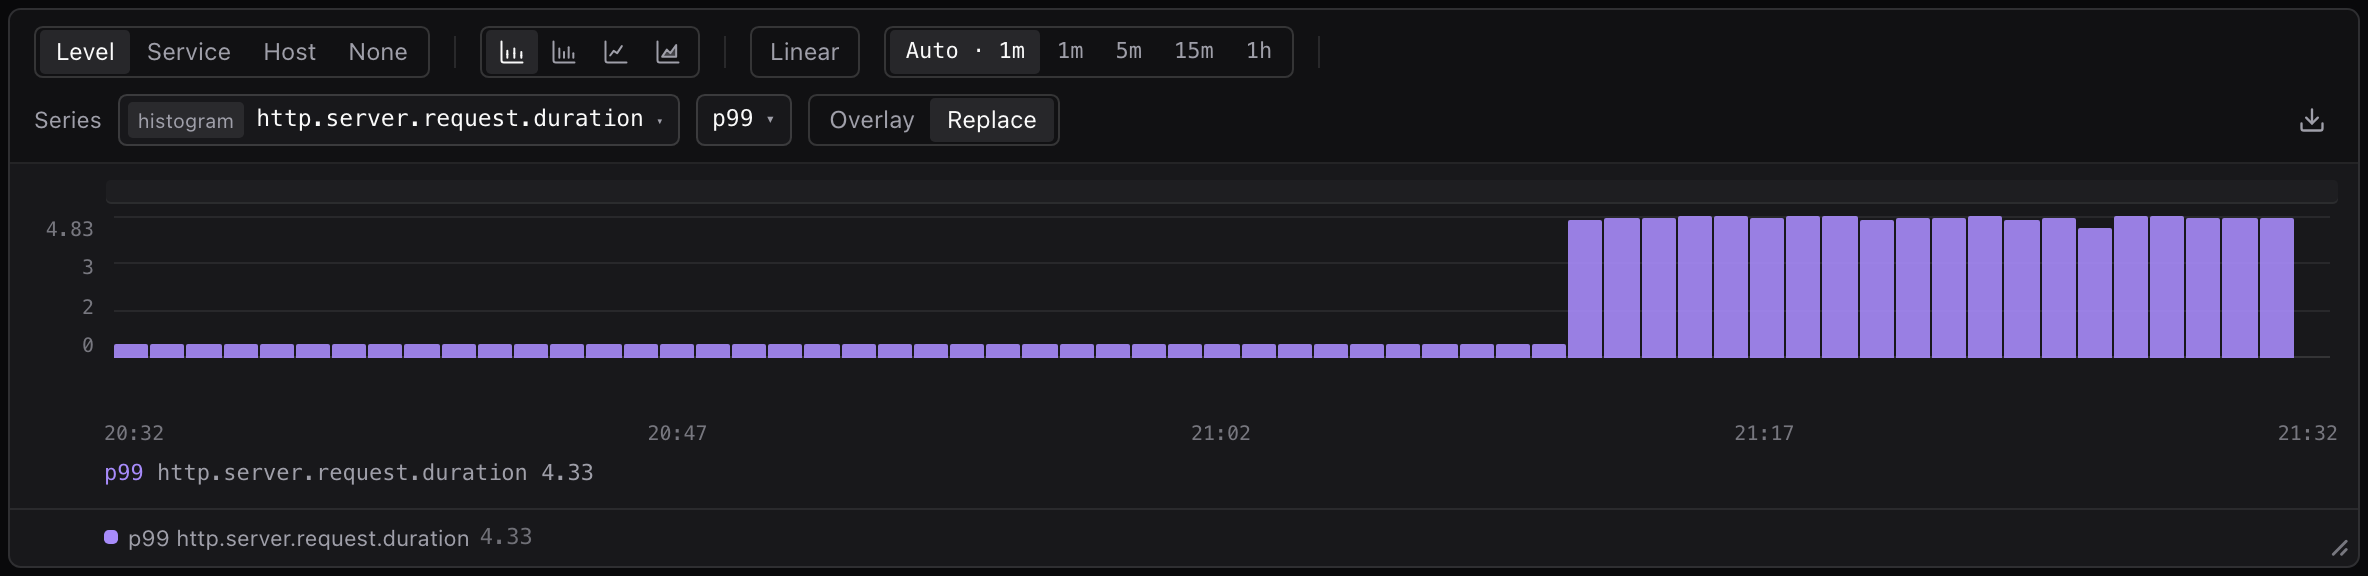
Type part of a name to pick any metric with points in the window. A histogram reads as count, sum, avg, p50, p90 or p99, and the reading is part of the link: metric=p99:http.server.request.duration.
Same hunt. We run it.
Hosted early access is planned for Q4 2026. The same product as the free self-hosted edition, operated by us.
check your inbox and confirm
No spam · no sales · confirm in your inbox