From the error, then a threshold.
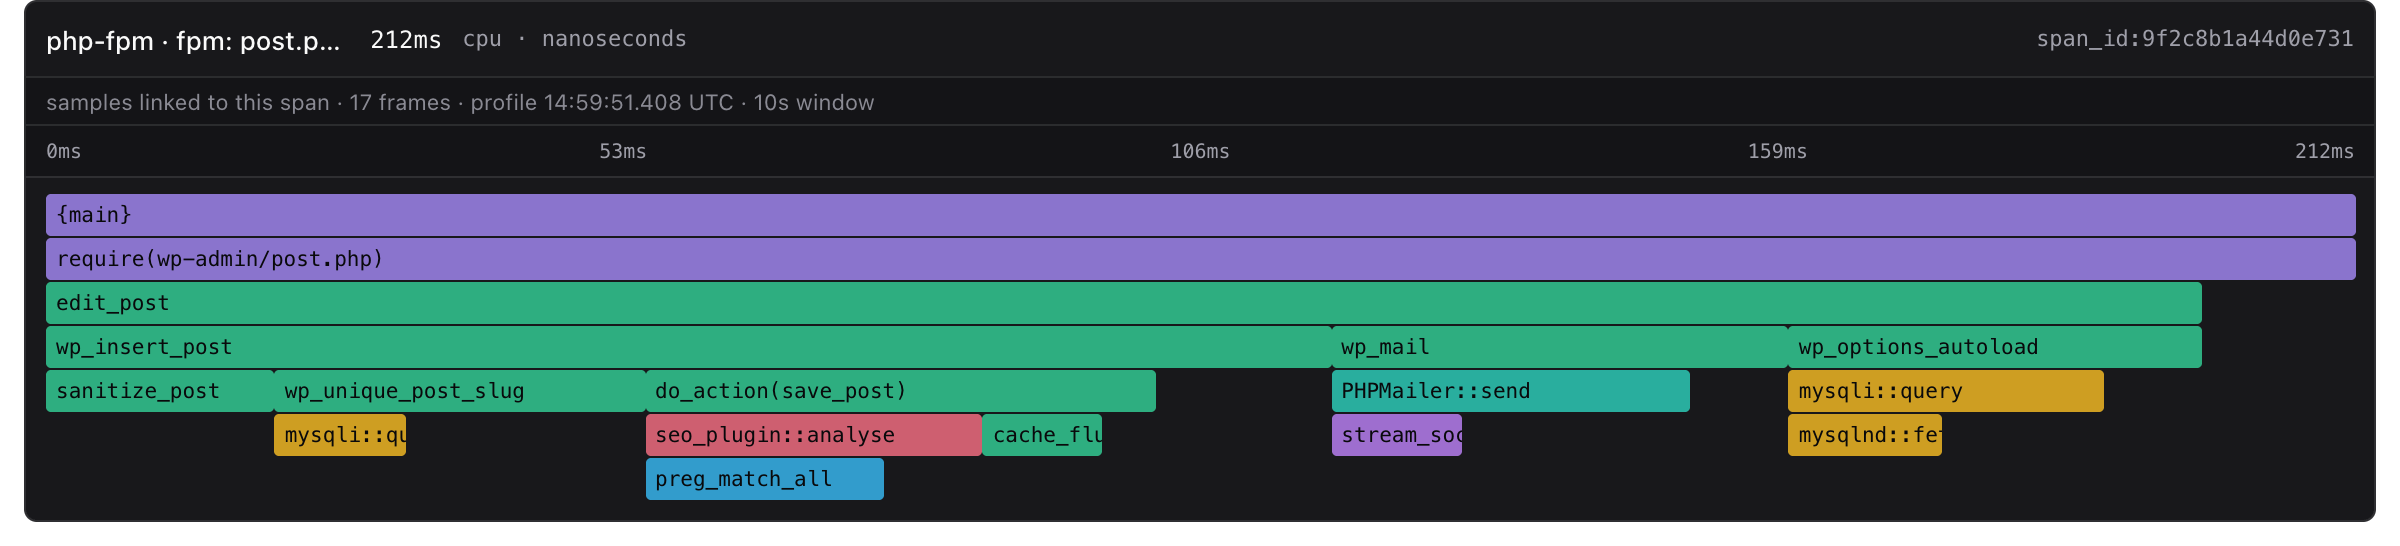
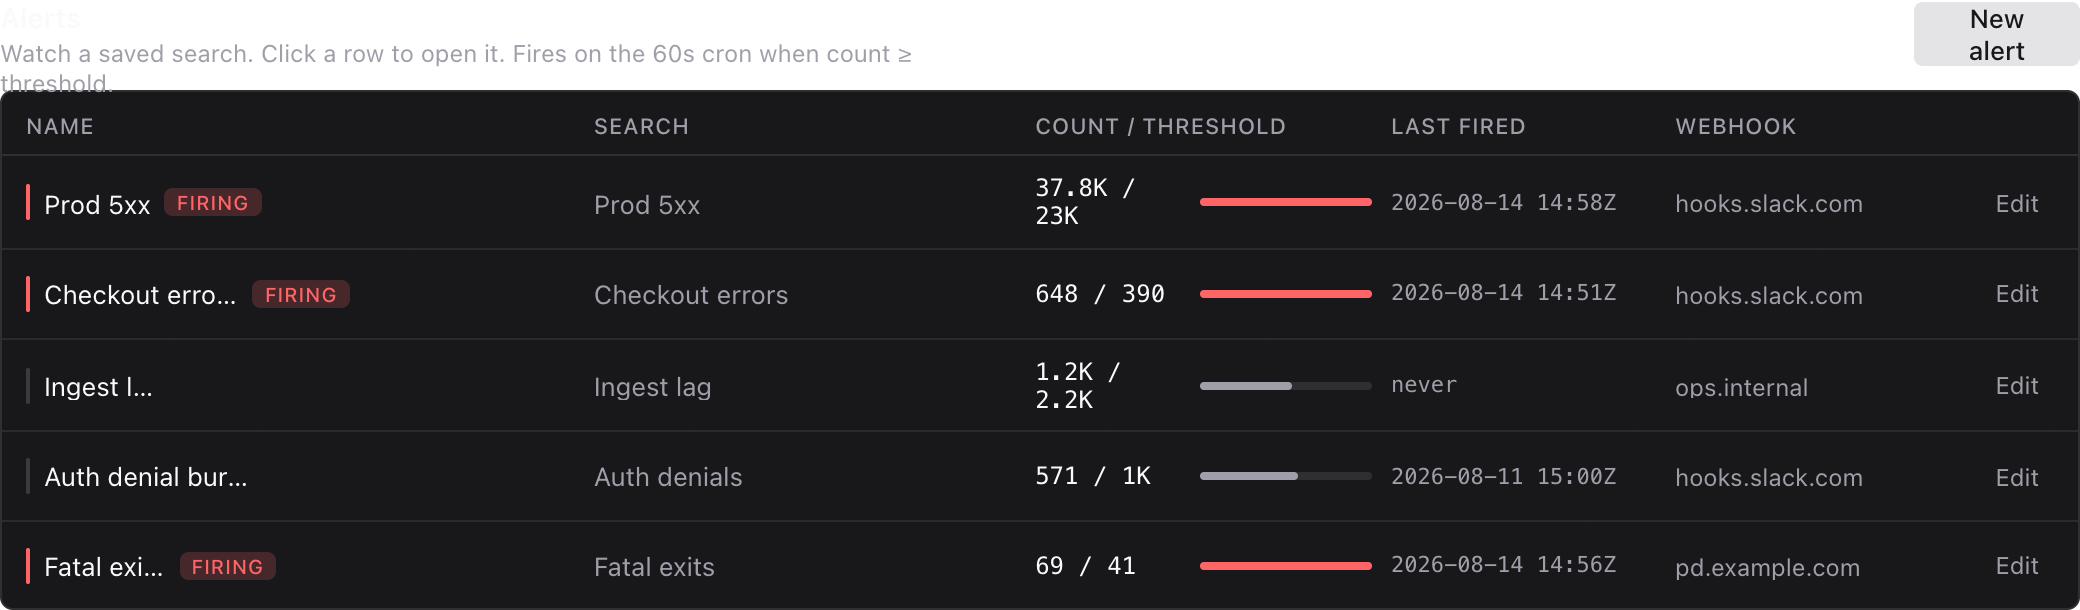
The request, then the time each service spent, then the function. A saved search can page Slack when the count crosses a line. Mute it when you already know. Every alert opens the search behind it.
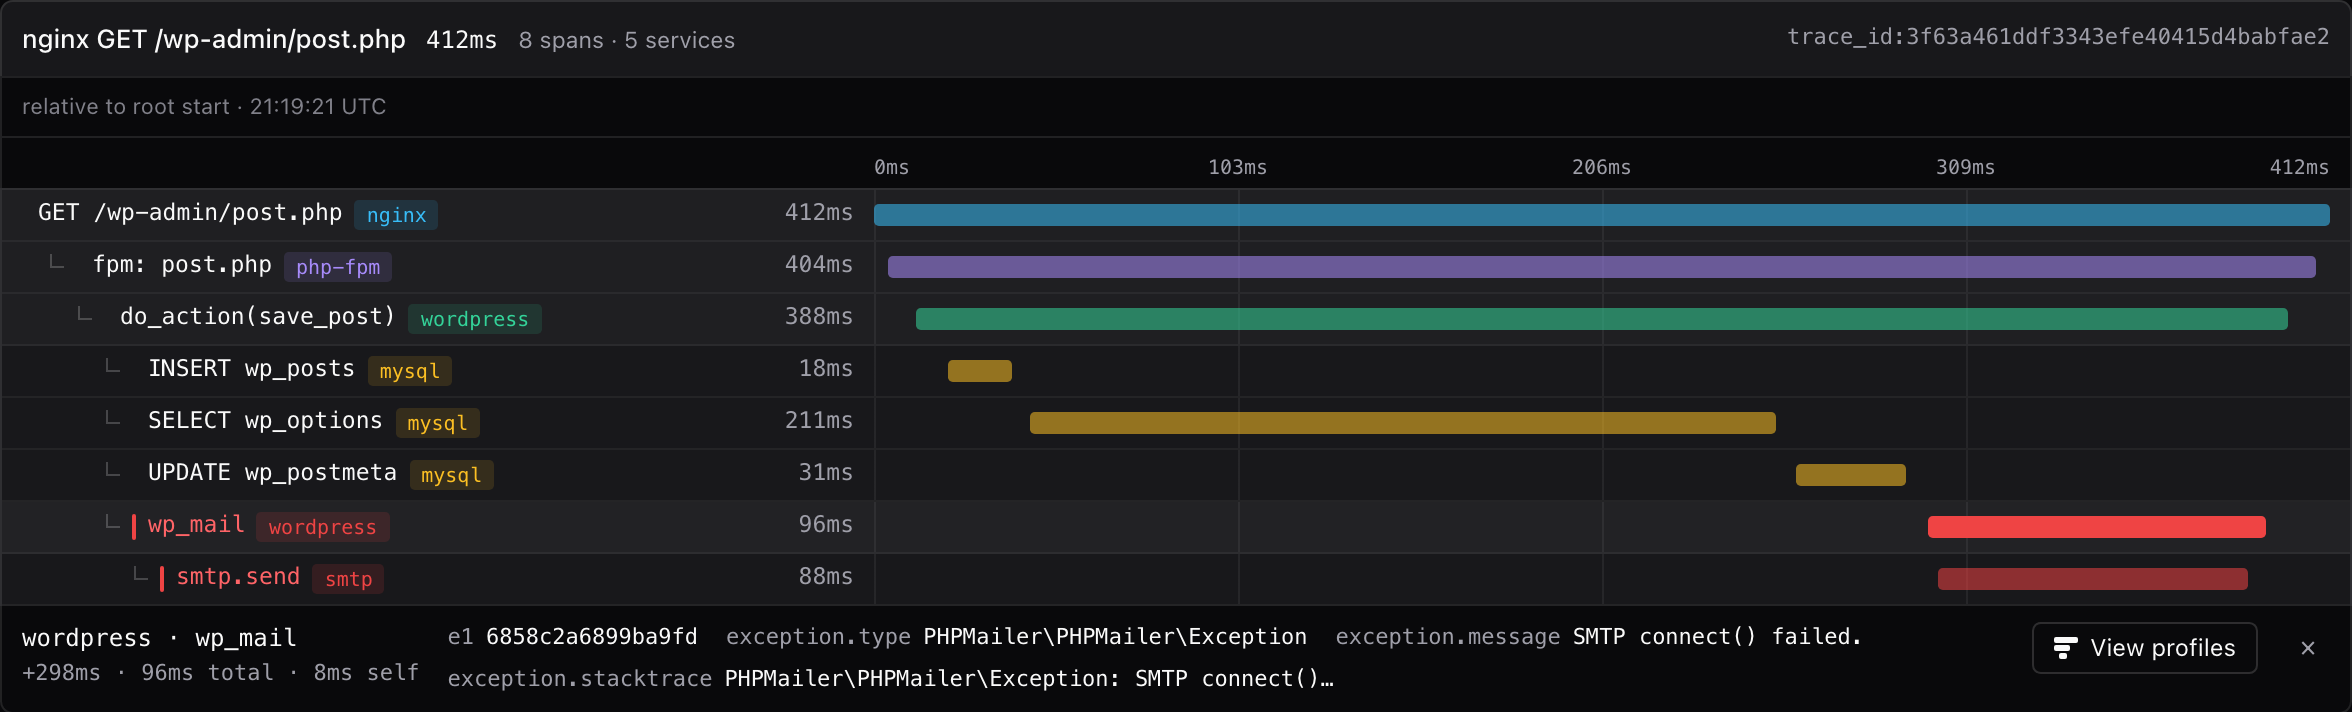
A span keeps the exception recorded on it. Select it and the waterfall shows the type, the message and the stack, with the same e1 as the log row that logged it. An exception still has to be logged to be hunted: Fingerprints, level:error and Compare read log rows.
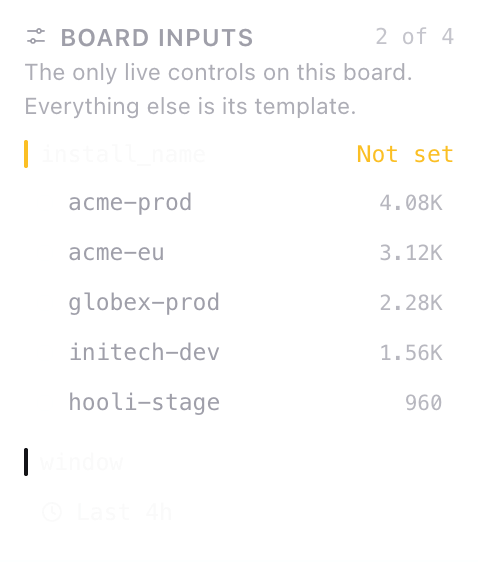
Customer, region or environment as a prompt. Then a count, delivered to Slack.
Same hunt. We run it.
Hosted early access is planned for Q4 2026. The same product as the free self-hosted edition, operated by us.
check your inbox and confirm
No spam · no sales · confirm in your inbox